Monitrix vs Datadog
For 20 APM and 50 infra hosts, Monitrix can save up to 80% of your Datadog bill - check comparison with detailed spreadsheet.
Why do Engineering Teams Choose SigNoz over Datadog?
Monitrix is often referred to as "Open-Source Datadog Alternative" by our users. We built Monitrix to address the absence of a great one-stop observability tool in the open-source ecosystem. Something that comes with the ease of a SaaS tool like Datadog but brings along the benefits of open-source standards.
Top reasons why developers prefer Monitrix over Datadog
True OpenTelemetry(OTel)-native solution
Monitrix is built from the ground up for OpenTelemetry. That means OTel-first docs, visualizations, & features are meant to truly take advantage of OpenTelemetry's potential. Datadog gives preference to its agent. If you want to do OpenTelemetry, Monitrix is the best choice.
Flexible Deployment Options
Monitrix provides both cloud & self-hosted versions. You can use the cloud, enterprise self-host, or free, open-source community edition, depending on your needs. Many of our users use open-source Monitrix in dev environments and Monitrix Cloud for production environments. Privacy-focused users prefer enterprise self-hosted version.
9x better value for money
Monitrix provides 9x more value for your money than Datadog. Complex billing practices, unpredictable pricing, and pricing that sometimes doesn't make sense are common issues that Datadog users highlight. Monitrix offers simple usage-based pricing and features that can help you take control of your observability costs better.
Product Comparison
OpenTelemetry-Native Support
Monitrix offers the best-in-class support for OpenTelemetry data. Datadog prioritizes support for its own agent. If you're using OpenTelemetry or planning to use it, Monitrix is a better choice than Datadog.
The table below summarizes some key differences in OpenTelemetry support between Monitrix and Datadog.
| Feature | Monitrix | Datadog | Remarks |
|---|---|---|---|
| OpenTelemetry-first docs | Yes | No | OTel-first docs makes it easier to integrate any data source (instrumented with OpenTelemetry) with Monitrix. |
| Automatic exceptions from OTel trace data | Yes | No | Monitrix provides a dedicated Exceptions tab that automatically lists down all exceptions captured automatically from an OTel instrumented application. |
| OTel-native messaging queue monitoring | Yes | No | Leveraging OTel's trace context propagation & semantic conventions, Monitrix provides end-to-end observability of messaging queues like Kafka & Celery. |
| Kubernetes Monitoring | Yes | Limited for OTel data | Monitrix uses the hostmetrics receiver in OTel Collector to collect all essential metrics from K8s nodes following OTel's semantic conventions. |
| Correlation of Telemetry data | Yes | Limited for OTel data | Jump from logs to related traces, or see host metrics in infra monitoring with out-of-the-box viz. in Monitrix for OTel data. |
| Pricing of OTel metrics | Charged like any metric | Charged as custom metrics | Datadog treats OpenTelemetry metrics as custom metrics which gets very expensive at scale. |
| OTel-based Feature Flags | Yes | No | Native support for openfeature feature flag. Learn More |
*Based on comparing support for monitoring the OpenTelemetry demo app on 24th December, 2024. | |||
Legacy observability tools like Datadog and New Relic are incentivized to provide better support for their own agents. Their product functionalities and pricing plans are tightly coupled with users using their proprietary agents.
We built Monitrix on top of OpenTelemetry from Day 1, and we're at the right place to realize the full potential of OpenTelemetry data.
Some highlights where we shine as an OpenTelemetry-native observability tool are mentioned below.
OpenTelemetry-first docs & visualization
Docs play a crucial role in the developer experience of any dev tool. Our docs are OpenTelemetry-first. Integration with any data source starts with instructions on how to use OpenTelemetry SDKs and libraries.
In Datadog, it's hard to find what you need if you're looking to use OpenTelemetry(and that's coming from us 😃). For example, if you want to instrument your Java application with OpenTelemetry, you can go to our Java APM docs, which has clear instructions and different ways to get started with OpenTelemetry. Datadog docs do not provide a clear starting point for someone starting with OpenTelemetry.
It's hard to make OpenTelemetry work with Datadog for many use-cases, and the internet is full of such anecdotes.
Some of our popular docs that can help you get started:
Messaging queue monitoring powered by OpenTelemetry
Most monitoring tools are limited to metrics for monitoring messaging queues like Kafka, Celery, etc. But leveraging OpenTelemetry's trace context propagation and semantic conventions, we've enabled end-to-end observability for messaging queues like Kafka.

With OpenTelemetry-powered correlated traces and metrics, you can dive deeper when troubleshooting any issue. You can trace the complete path of a message from producer to consumer with traces and resolve your issues quickly.
Powerful correlation between different telemetry signals collected with OpenTelemetry
OpenTelemetry's semantic conventions provide a standardized way to annotate telemetry data (logs, metrics, and traces) with well-defined attributes, enabling seamless correlation across these signals.
But its true potential can only be realized if the observability backend to which the data is sent to, enables switching between signals easily. In Monitrix, the collection of telemetry signals is powered by OpenTelemetry. And by leveraging its semantic conventions, we have enabled things like:
- APM metrics to traces
- APM metrics to logs
- Traces to logs and vice-versa
- Logs to infra metrics
- Infra metrics to logs and traces
And more is coming in future product roadmap. Correlated signals empower you with rich context to troubleshoot when issues occur.
Metrics sent by OpenTelemetry are charged as custom metrics in Datadog
One of the challenges of using OpenTelemetry with Datadog is that it treats any metric sent by using OpenTelemetry SDKs as a custom metric. Custom metrics in Datadog are charged separately and can get very expensive at scale.

At Monitrix, all metrics are treated equally and reasonably priced at $0.1 per million samples.
Application Performance Monitoring (APM)
Our APM capabilities are on par with those of Datadog. With a simplified user interface, lots of users find Monitrix to be much easier to operate and monitor their applications with our APM module.
| Feature | Monitrix | Datadog | Remarks |
|---|---|---|---|
| Out-of-the-box charts for top application metrics | Yes | Yes | We provide out of box charts for RED metrics and other crucial metrics like Apdex. |
| Request Rate | Yes | Limited | DD derives a "primary operation" out of all endpoints and all RED metrics are shown based on this "primary operation". This approach doesn't give you a service-level view of performance. |
| Latency p99, p90, p50 | Yes | Limited | Same as above. |
| Error Rate | Yes | Limited | Same as above. |
| Apdex | Yes | Yes | Apdex is an open standard that defines a method to report, benchmark, and rate application response time |
| Top-Level Operations Detection | Automatically detects all top-level spans | Limited to endpoint-specific views | Datadog lacks full service-level latency aggregation that includes major endpoints in a service. |
| APM Metrics to logs, traces & infra metrics | Yes | Yes | Go from APM metrics to related logs, traces and infra metrics. |
| Service-Level Alerting | Alerts for overall service metrics | Requires per-endpoint alert setup | As Datadog treats just one endpoint as the primary operation in a service, you can not set a service-level alert that will be representative of service-level issues. |
| Database Calls RPS, Database Calls Avg Duration | Yes | Yes | Check Database calls metrics made from any service. |
| RED Metrics for External Calls | Yes | Limited | Monitrix simplifies tracking RED metrics for external calls - click on service page of any service, and check external call metrics made by that service. |
| OpenTelemetry-native APM docs | Yes | No | If you want OTel based APM, then Monitrix is a clear choice. |
| OpenTelemetry-first visualization | Yes | No | All our out-of-the box charts are based on OTel data. |
| Code Hotspots | No | Yes | Not available in Monitrix |
Datadog derives a "primary operation" out of all endpoints for a service, and all RED metrics are shown based on this "primary operation". This is not a correct approach because a service can have N primary operations, all of which are important.
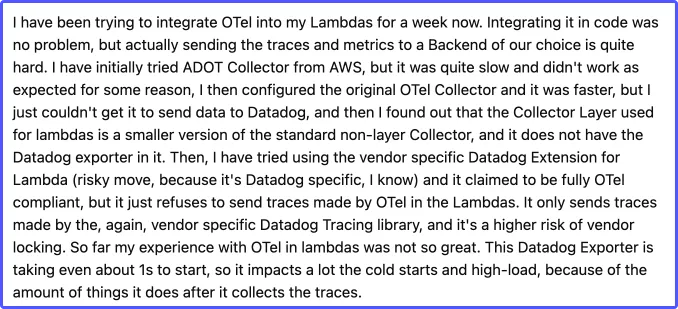
For example, cart service from the OTel demo app has multiple endpoints with significant RPS:
- POST /oteldemo.CartService/AddItem
- POST /oteldemo.CartService/GetCart
Key operations shown for Cart Service in Monitrix
Service-level RED metrics in Monitrix are derived from a combination of service top endpoints that are representative of service-level performance.
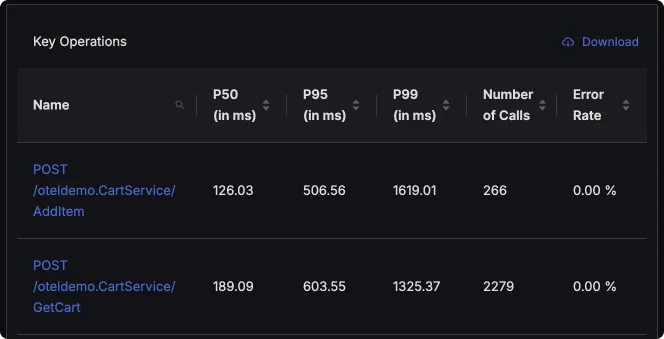
On the other hand, Datadog shows service summary derived from stats of only one endpoint, in this case, POST /oteldemo.CartService/GetCart.
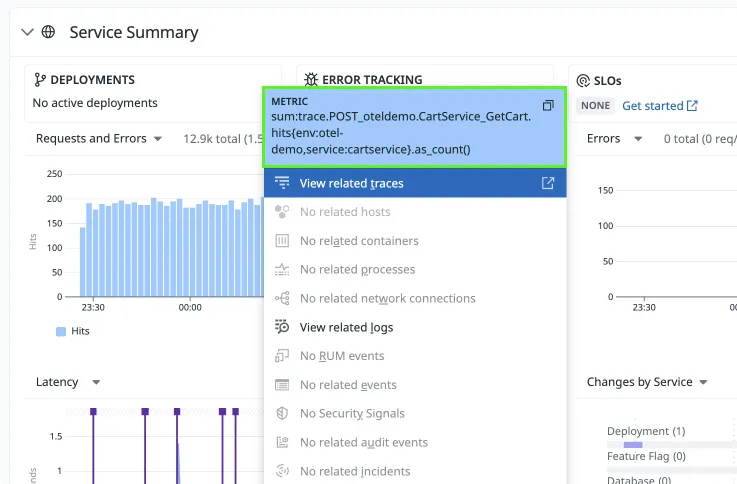
Datadog shows servcie-level metrics derived from only one primary operation
This limits things like Service-Level Alerting. You will be required to set up alerts per end-point. Service-level alerts are useful to monitor the overall health of your service.
Log Management
Our logs module, powered by ClickHouse and in-house optimizations, delivers fast querying and filtering for logs at scale.
| Feature | Monitrix | Datadog | Remarks |
|---|---|---|---|
| High Cardinality filtering at scale | Yes | Limited | Under the hood, Monitrix uses ClickHouse(used by likes of Uber) - an extremely fast and highly optimized storage for observability data. |
| Quick search & filter | Yes | Yes | Quickly search and filter your logs by filling attributes, tags, etc. in search bar or using the quick filter menu. |
| Logs to Traces | Yes | Limited for Otel Data | Click on detailed view of logs and go to related span if trace id is present in logs. |
| Logs to Infra Metrics | Yes | Yes | Click on detailed view of logs and see infra metrics from the host generating the logs |
| Timeseries plot | Yes | Yes | See timeseries plot of logs sent. In Monitrix you can apply different aggregations like count, avg., min, max, etc. In Datadog only count operation is allowed. |
| Table View | Yes | Yes | Same as above. |
| List View | Yes | Yes | See all your log lines in list view with options to customize the view. |
| OTel-based Logs UI | Yes | No | Our logs UI respects the hierarchy of OTel logs model making it easier for users to identify the type of attributes/tags they use for filtering. |
| Saved Views | Yes | Yes | Apply filters & aggregations and save them as views for quick access later. |
| Log Patterns | No | Yes | Logs Patterns help you identify patterns in logs sent. We don't have this currently, but it is there in our product roadmap |
| Ability to configure quick filters | No | Yes | You can configure the filters in quick filter menu bar which comes handy in fast troubleshooting. |
Distributed Tracing
| Feature | Monitrix | Datadog | Remarks |
|---|---|---|---|
| Search on all spans | Yes | Limited to live search | Datadog allows search on only indexed spans. Live search is available for all spans only for past 15 minutes. |
| Quick Filters | Yes | Yes | Use the quick filter menu list to quickly zero down on spans you want to see. |
| Aggregations on trace data | Yes | Limited to simple operations like count | Monitrix provides a powerful query builder which allows a list of aggregations like count, min, max, latency, rate_sum, rate_avg. etc. |
| Arbitrary attribute-based querying & aggregations | Yes | No | You can choose any arbitrary attribute to create aggregations in Monitrix. Datadog only allows it on some top level attributes. |
| List View | Yes | Yes | See all your spans in list view with options to customize the view. |
| Time Series | Yes | Yes | See all your spans in list view with options to customize the view. |
| Table View | Yes | Yes | Apply filters based on attributes and apply aggregations like count, min, max, latency and see results in table view. Datadog allows only the count operation. |
| See Root Spans | Yes | Yes | Root spans are the entry point for any trace. In Monitrix you can view them in a different panel. |
| Tree Map & Pie Chart View | No | Yes | Datadog provides more visualization options for your trace data. |
| Flamegraphs | Yes | Yes | Flamegraphs are used to commonly to represent trace data. |
| Trace Waterfall | Yes | Yes | Trace waterfall shows the how order of operations cascades across the total execution time of that trace. |
| Spans to related logs | Yes | Yes | Both Monitrix and Datadog shows related logs with a span. The UX might be different in each case. |
Infrastructure Monitoring
Datadog is a better choice if you're looking to do only infrastructure monitoring.
But if you're looking to use OpenTelemetry, Monitrix is a better choice. OpenTelemetry Collector has a hostmetrics receiver that allows you to collect important infra metrics.
The resource attributes collected with OTel follows the semantic conventions, which means it can be correlated easily with other signals like logs and traces.
| Feature | Monitrix | Datadog | Remarks |
|---|---|---|---|
| K8s Cluster Monitoring | Yes | Yes | Get charts for monitoring common resource metrics like CPU, memory, etc. from K8s pods & nodes. |
| VM Monitoring | Yes | Yes | Get charts for monitoring common resource metrics like CPU, memory, etc. from VMs. |
| Infra metrics to logs | Yes | Yes | Correlate your infra metrics with logs. |
| Infra metrics to traces | Yes | Yes | Correlate your infra metrics with traces. |
| Host & Container Maps | No | Yes | Get a map of your machinces/containers in your infra for a comprehensive view. |
| Control Infra Monitoring Cost | Yes | No | In Datadog you cannot control the metrics you send for Infra monitoring, while in Monitrix you will have granular controls on what metrics you want to send from any host. |
Datadog has a vast array of capabilities when it comes to infrastructure monitoring. You can check out more details about their infrastructure monitoring capabilities on their website.
Other Platform Capabilities
Some of the platform capabilities that we don't offer today and for which Datadog is a good choice.
| Feature | Monitrix | Datadog | Remarks |
|---|---|---|---|
| Real User Monitoring | No | Yes | Monitor real user interactions and frontend performance |
| Session Replays | No | Yes | Replay user sessions to debug issues |
| Synthetic Monitoring & Testing | No | Yes | Simulate and monitor user flows |
| Cloud SIEM | No | Yes | Security information and event management |
Monitrix is 9x More Value for Money than Datadog
Datadog has a very complex pricing tier which makes Datadog bills unpredictable. For 20 APM hosts, 50 infra hosts, and 2500 GB logs data, Monitrix can provide up to 9x more value than Datadog. (Learn More)
Get up to 9x more value for money with SigNoz
Some of the highlights of why our pricing plan is better suited at scale are mentioned below.
Simple usage-based pricing
Datadog has complex SKU-based pricing, which is difficult to break down and predict costs. The complex billing structure makes it hard to predict how much you will be charged at the end of the month.
We offer a simple usage-based pricing plan based on the amount of data that you send to Monitrix.
No special pricing for custom metrics
Datadog's custom metrics pricing is insane. It charges $0.05 per custom metric. You can end up with unpredictable bills, and custom metrics pricing can constitute up to 52% of your bill for a large engineering team. Monitrix does not treat custom metrics differently and charges only $0.1 per million samples. (Learn more)
Better controls on infra monitoring cost
In Datadog, you don't have any controls on the type of metrics sent to monitor your infrastructure. Hence, you can't optimize your infrastructure monitoring bill in Datadog. Each infrastructure host is charged at $18 per month.
Monitrix lets you collect infra metrics through the hostmetrics receiver in OpenTelemetry Collector, with which you can control what metrics to send.
No Host (container or node) based pricing
Because of Datadog's host-based pricing, some users are actually trying to optimize their microservices architecture to reduce the cost. The fact that they charge based on a number of hosts trips up many teams - and leads to many teams packing more services in a single host to keep their DataDog bill under control.

Ability to create data ingestion limits with Ingest Guard
Our Ingest Guard feature can help you control observability costs by providing granular controls over data ingestion. You can set data ingestion limits with our ingestion keys.
It enables a number of use cases around control of data ingestion and observability costs:
- Set data ingestion limits based on the type of signal. For example, a daily limit of 100GB on logs data ingestion.
- Set data ingestion limits based on engineering teams. For example, you can allot 100GBs per day to Team A and 200GBs per day to Team B based on the use case.
- Create separate ingestion keys for various environments (e.g., production, staging, development) to control data sent from each environment individually.
Listen to Shiv Ansal, CTO at Bands, explaining why he chose Monitrix over Datadog for his startup, Bands.
